Demand Clustering and Segmentation with Machine Learning in Logistics (Kmeans, scikit-learn, matplotlib)

In the field of logistics, understanding and predicting customer demand patterns is crucial for optimizing supply chain operations. By employing machine learning techniques, we can cluster and segment demand data to uncover valuable insights and make informed decisions. In this tutorial, we will explore how to perform demand clustering and segmentation using Python and popular machine learning libraries.
Prereqs
To follow along with this tutorial, you’ll need:
- Python 3.x installed on your system
- The following Python libraries: pandas, numpy, scikit-learn, matplotlib
You can install the required libraries using pip:
pip install pandas numpy scikit-learn matplotlib
Step 1: Data Preparation
The first step is to gather and prepare the demand data for analysis. This typically involves loading the data into a pandas DataFrame and performing any necessary preprocessing steps such as handling missing values or normalizing the data. For this tutorial, we’ll assume you have a CSV file containing demand data with the following columns: date, product_id, quantity.
Let’s start by importing the necessary libraries and loading the data:
import pandas as pd

# Load the demand data from CSV
demand_data = pd.read_csv('demand_data.csv')
Next, we can examine the data and perform any necessary preprocessing steps. This might include handling missing values, converting data types, or normalizing the data. Preprocessing steps will vary depending on the specific dataset and requirements of your analysis.
Step 2: Feature Engineering
To apply machine learning algorithms, we need to extract relevant features from the demand data. In this tutorial, we’ll use the following features: product_id, quantity, and date (as a temporal feature). We’ll transform the date column into separate features such as year, month, day, and day of the week. Additionally, we can include other domain-specific features if available, such as product category or customer segment.
Let’s create a function to perform feature engineering:
from datetime import datetime

def engineer_features(data):
    # Convert date column to datetime
    data['date'] = pd.to_datetime(data['date'])
    # Extract year, month, day, and day of the week
    data['year'] = data['date'].dt.year
    data['month'] = data['date'].dt.month
    data['day'] = data['date'].dt.day
    data['day_of_week'] = data['date'].dt.dayofweek
    # Include other relevant features if available
    return data
# Apply feature engineering
demand_data = engineer_features(demand_data)
Step 3: Demand Clustering
Now that we have prepared our data and engineered the necessary features, we can proceed with demand clustering. Clustering is an unsupervised learning technique that groups similar instances together based on their features. In our case, we want to cluster demand patterns based on the extracted features.
For this tutorial, we’ll use the popular K-means clustering algorithm. Let’s import the required libraries and perform the clustering:
from sklearn.cluster import KMeans

# Select relevant features for clustering
features = ['quantity', 'year', 'month', 'day', 'day_of_week']
# Perform clustering
kmeans = KMeans(n_clusters=3)
clusters = kmeans.fit_predict(demand_data[features])
In the code above, we selected the features to be used for clustering (quantity, year, month, day, day_of_week) and specified the number of clusters to be 3. You can adjust these parameters according to your specific use case.
Step 4: Demand Segmentation
Once we have performed demand clustering, we can further segment the clusters to gain deeper insights into different customer demand patterns. Segmentation helps us understand distinct groups within each cluster, allowing us to tailor our logistics strategies accordingly.
In this tutorial, we’ll use the K-means clustering results to perform segmentation. We’ll calculate the centroid of each cluster and assign demand data points to the nearest centroid. This will help us identify which products or time periods belong to each segment within a cluster.
Let’s continue with the code:
# Add cluster labels to the demand data
demand_data['cluster'] = clusters

# Calculate the centroid of each cluster
cluster_centroids = pd.DataFrame(kmeans.cluster_centers_, columns=features)
# Segment the demand data based on cluster centroids
segment_labels = kmeans.predict(cluster_centroids)
demand_data['segment'] = demand_data['cluster'].apply(lambda x: segment_labels[x])
In the code above, we added the cluster labels to the demand data. Then, we calculated the centroid of each cluster using the cluster_centers_ attribute of the K-means model. Next, we predicted the segment labels for each cluster centroid using the predict method. Finally, we assigned the segment labels to the demand data based on their corresponding cluster.
Step 5: Visualizing Clusters and Segments
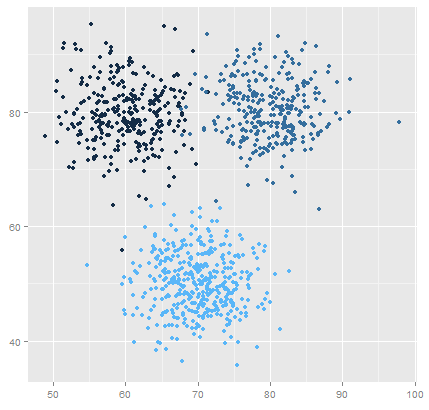
To better understand the clustering and segmentation results, it’s helpful to visualize them. We can plot the clusters and segments on different charts to observe patterns and identify differences between them.
Let’s create a scatter plot to visualize the clusters:
import matplotlib.pyplot as plt

# Plot clusters
plt.scatter(demand_data['quantity'], demand_data['year'], c=demand_data['cluster'])
plt.xlabel('Quantity')
plt.ylabel('Year')
plt.title('Demand Clusters')
plt.show()
Similarly, we can create a bar chart to visualize the segments:
segment_counts = demand_data['segment'].value_counts()

# Plot segments
plt.bar(segment_counts.index, segment_counts.values)
plt.xlabel('Segment')
plt.ylabel('Count')
plt.title('Demand Segments')
plt.show()
By visualizing the clusters and segments, we can gain insights into the distinct demand patterns within our data. This information can be used to make data-driven decisions and optimize logistics operations accordingly.
In this tutorial, we explored how to perform demand clustering and segmentation using machine learning in logistics. We learned how to prepare the data, engineer relevant features, apply clustering algorithms, and segment the results. Additionally, we visualized the clusters and segments to gain insights into the demand patterns.
By employing these techniques, logistics professionals can effectively analyze customer demand, uncover hidden patterns, and optimize their supply chain operations for improved efficiency and customer satisfaction.
Remember, demand clustering and segmentation is just one aspect of utilizing machine learning in logistics. There are many other techniques and models that can be applied to tackle different challenges in the field. So feel free to explore further and expand your knowledge!
Happy coding!
